

Progress Chef provides tools and solutions for organizations looking to deliver their infrastructure management, automation, compliance and remediation needs. Given the critical nature of these capabilities, organizations often implement high availability (HA) measures to guarantee the constant accessibility of the systems supporting the Chef solution. Beyond mere availability, the capability to actively monitor performance enables organizations to take a proactive stance in addressing any deviations from expected system behavior.
One of the many benefits of running infrastructure and services in AWS is the ability to monitor the resources with built-in capabilities. Amazon CloudWatch allows organizations to get visibility for the systems and services running in the AWS cloud but can also be extended to other clouds and on-premises environments, providing that single pane of glass for infrastructure. The performance of applications can be visualized through dashboards and alarms can be created to notify teams of outages and other issues that can impact productivity. With the detailed metrics and log analytics delivered by AWS CloudWatch, organizations can ensure the maximum uptime for applications and services that the business relies on.
Chef Automate HA with AWS CloudWatch helps provide automation and compliance teams with the necessary redundancy and visibility to operate the solution successfully. This blog will highlight some of the AWS CloudWatch features that can be enabled to improve the observability of the Chef infrastructure.
CloudWatch Metrics
The configuration of CloudWatch starts with setting up Monitoring rules and a collection of available metrics to gain the necessary visibility of the Chef Automate HA environment. The following Chef Automate HA systems and services should be monitored to ensure overall health.
- Chef Automate Server
- Chef Infra Server
- OpenSearch Server (running as a Service or in an EC2 instance)
- Postgres Server (running as a Service or in an EC2 instance)
- Bastion Node
- System and Disk level usage and performance level metrics
Customers will have to select between the different options for AWS CloudWatch monitoring. Basic monitoring is offered by many AWS services and includes a default set of metrics with no charge to customers. Detail monitoring is only offered for a select number of services and does incur a charge. These options can be further explored on the AWS website.
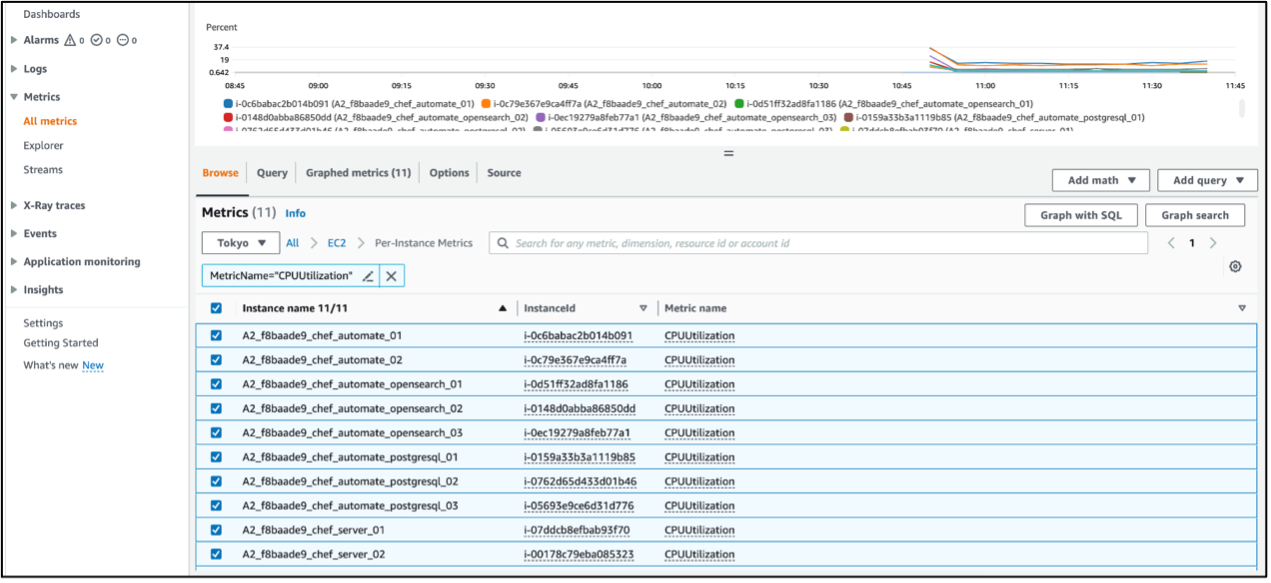
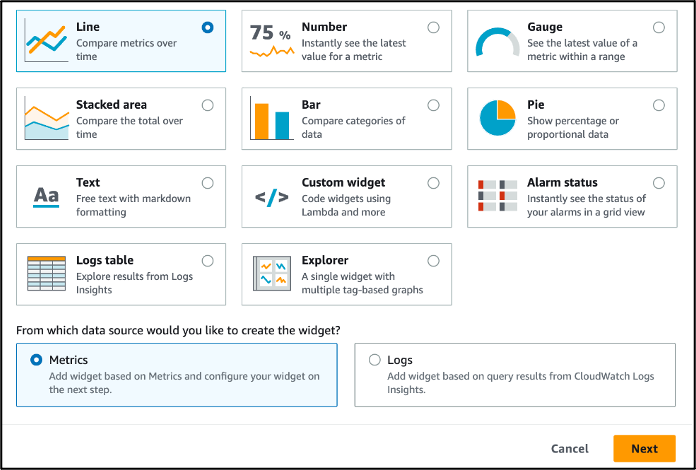
To start with AWS monitoring navigate to the CloudWatch Console and select Metrics and All Metrics from the menu. As all organizations are unique regarding what should be monitored, choose all the metrics that are meaningful to the team to get the right level of observability.
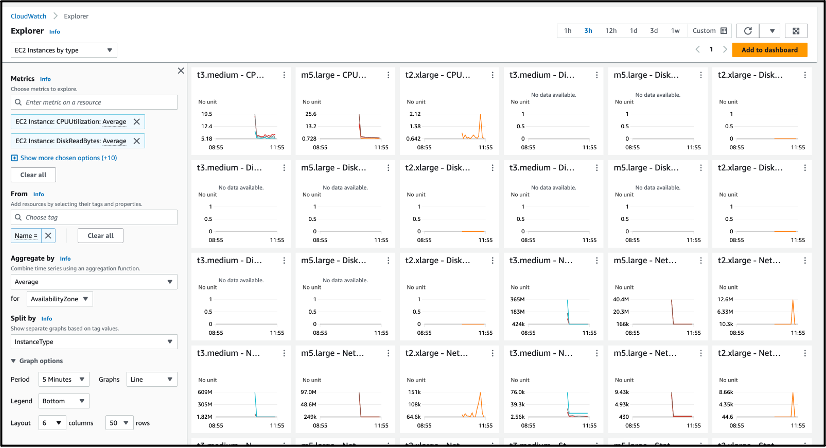
Metrics Explorer can be leveraged to monitor Chef Automate HA resources by tags. By choosing Explorer under the Metrics menu, the ability to filter, aggregate and visualize data by tags and properties is made available.
The following table lists recommended metrics that should be monitored for the Chef Automate HA environment. This list should only be used as a reference and the metrics captured should be defined by the teams responsible for managing the Chef Automate HA solution.
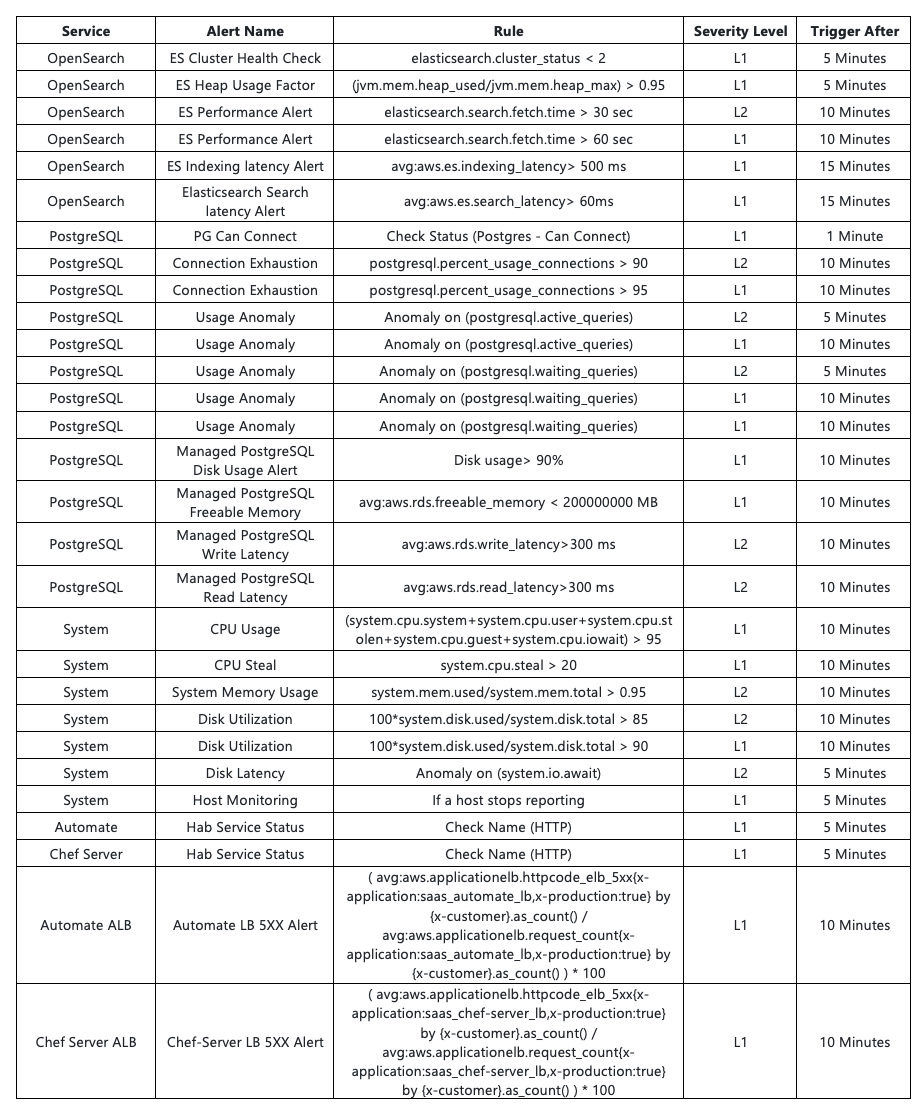
Learn more information on metrics
CloudWatch Dashboards
All the Metrics provided by AWS CloudWatch can be easily presented in Dashboards to give teams a clear picture of the performance and health of the Chef environment. Dashboards are customizable and can be used to monitor all metrics in a centralized location regardless if resources are within one region or spread across multiple.
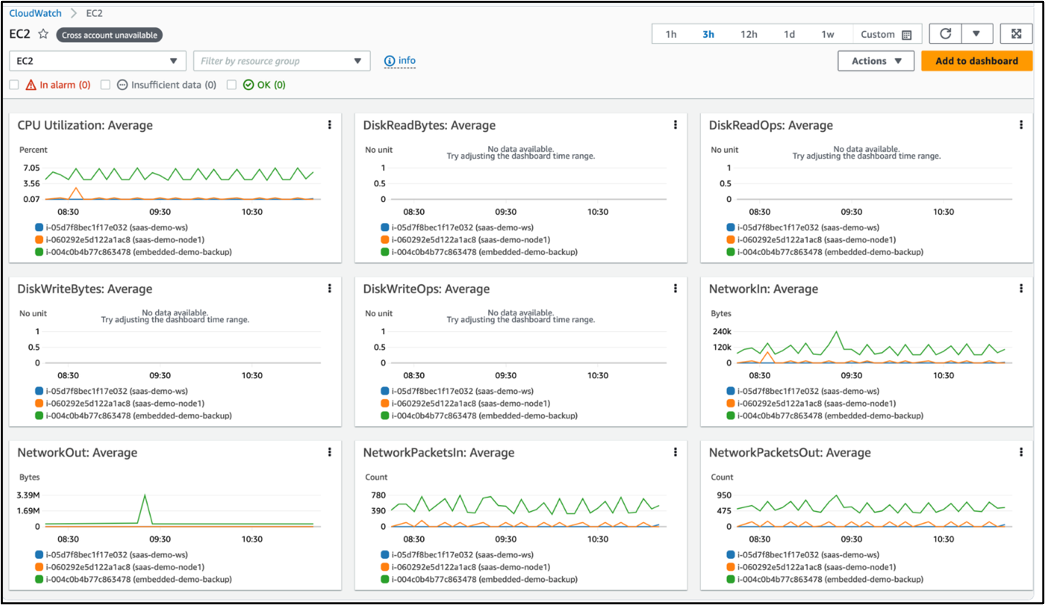
CloudWatch enables users to visualize metrics differently, which is beneficial depending on the systems or services being monitored.
Learn more information on dashboards
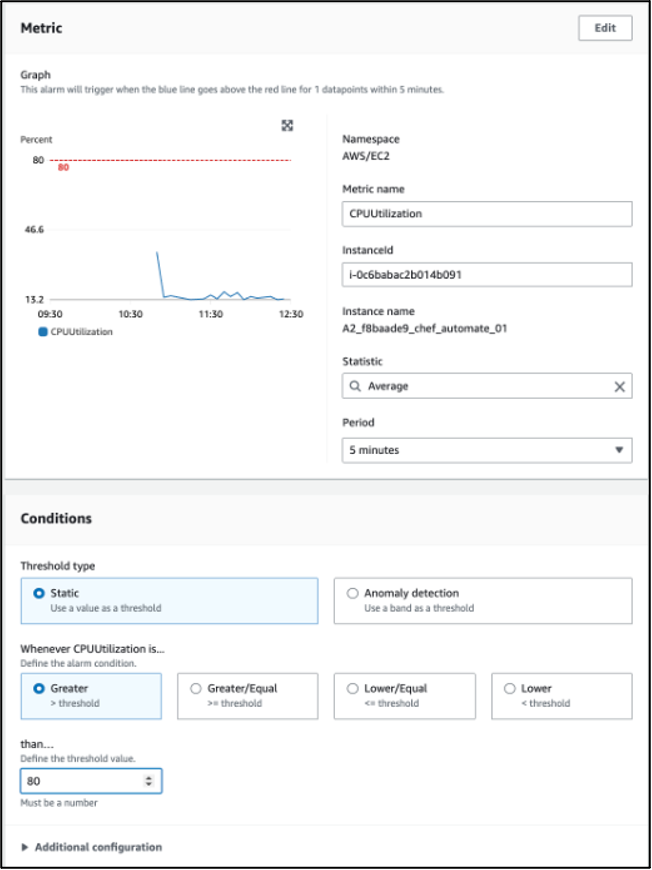
CloudWatch Alarms
While Dashboards can help effectively oversee various facets of the Chef Automate HA environment, it's impractical to continuously monitor all performance metrics around the clock throughout the entire year for any anomalies. That is where AWS CloudWatch alarms are leveraged, allowing conditions to be defined on the metrics and the ability to trigger alerts to the right teams when the threshold falls outside the expected limits. Teams can then be proactive in looking into potential problems and avoid any kind of disruption whether that be an impact on performance or preventing an outage.
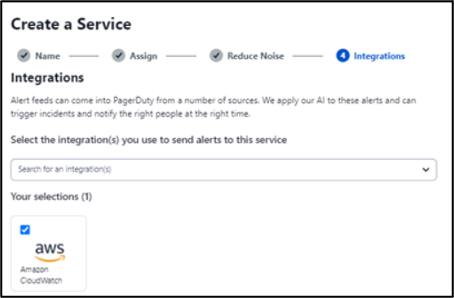
There are several integrations with CloudWatch alarms on where to send the alerts. Some of the more popular options would be Pager Duty and Slack. Both integrations leverage the AWS Simple Notification Service (SNS) enabling users to utilize different protocols to communicate with these third-party solutions.
Starting with PagerDuty, there is a built-in integration that can be selected as part of the creation of a PagerDuty Service. By Selecting the AWS CloudWatch integration, a unique URL is created which can be used within the SNS configuration to send alerts. Teams set up within the PagerDuty Escalation Policy will be notified when an alarm is triggered and when the system returns to a normal level.
Learn more information on setting up PagerDuty Integration
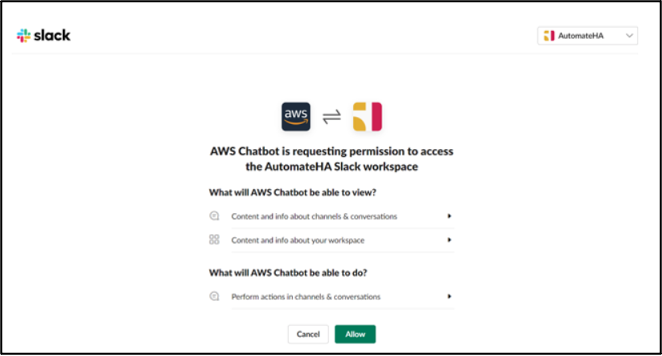
The integration with Slack requires an additional service to get the communication established with AWS CloudWatch. Although using AWS Lambda functions is an option, the easier solution is to leverage the AWS ChatBot service. This service was launched in 2019 and does not require any code to integrate with Slack. By simply selecting Slack in the AWS Chatbot dropdown menu, you are redirected to Slack where you will authenticate and select the Slack Workspace you would like to send alerts to.
Once established, the selection of an SNS Topic and specific permissions will need to be applied to finalize the integration. All users and teams with access to the configured Slack Workspace will be immediately notified when an alarm is triggered.
Learn more information on setting up Slack
With the importance placed on the Chef Automate HA environment, there must be a proper monitoring solution put in place to keep a close eye on performance and availability. AWS CloudWatch is just one of the many options organizations can take advantage of to ensure the solution is operating at its full potential to handle all the Chef Automate, infrastructure management and compliance functions to help grow and secure the business.