

In the fast-paced realm of DevOps and infrastructure management, High Availability (HA) isn't merely a luxury, it's a necessity. As businesses rely more than ever on continuous delivery pipelines and automated workflows, the ability to support uninterrupted access to crucial data and insights becomes a critical component of success.
Enter Progress Chef Automate, the solution helping to streamline configuration management, compliance and application delivery.
Chef Automate HA is an infrastructure setup designed to maintain continuous and uninterrupted operation of the Chef Automate platform. HA achieves this by creating redundancy and fault tolerance in the system.
This setup is indispensable for organizations intolerant of downtime. It reduces disruptions, enhances reliability and optimizes the performance of Chef Automate, thereby meeting crucial automation and configuration management requirements. But when it comes to monitoring and centralizing logs for the HA environment of Chef Automate, the ELK stack emerges as an invaluable companion.
The ELK stack – a trio of open-source tools that has revolutionized the way businesses harness their data. Elasticsearch, Logstash and Kibana, collectively known as ELK, offer a dynamic solution for data analytics, log management, and real-time visualization.
Let's delve into the fundamental elements that constitute the ELK stack, starting with Elasticsearch.
- Elasticsearch serves as the cornerstone of the ELK stack. A search engine designed to house and index all the logs it gathers.
- Logstash is the data processing element responsible for forwarding incoming logs to Elasticsearch.
- Kibana is a web-based interface used for visualizing and searching logs stored within Elasticsearch.
The unrecognised part of this stack, Filebeat will be employed to transmit logs from Chef Automate HA nodes to Logstash.
Typically, organizations deploy ELK components across multiple systems to enhance scalability and ensure redundancy. However, let us look into the installation process if it were to be done on a single system. Before we dive into the installation steps, we must ensure that our environment meets the necessary prerequisites.
ELK relies on Java, so let's begin by checking if Java is installed and, if not, install it using the following command:
$ sudo apt-get install openjdk-8-jdkNext, we'll proceed to download and install the essential public signing key to verify the authenticity of our ELK installation:
$ wget -qO - https://artifacts.elastic.co/GPG-KEY-elasticsearch | sudo gpg --dearmor -o /usr/share/keyrings/elasticsearch-keyring.gpg- To enable a more secure installation from the APT repository, we also need to install the apt-transport-https package:
$ sudo apt-get install apt-transport-https - With these prerequisites in place, we're now ready to configure the APT repository for ELK. We'll save the repository definition to a specific location:
echo "deb [signed-by=/usr/share/keyrings/elasticsearch-keyring.gpg] https://artifacts.elastic.co/packages/8.x/apt stable main" | sudo tee /etc/apt/sources.list.d/elastic-8.x.list
By completing these steps, we've set the stage for a successful ELK installation. These prerequisites ensure that our system is ready to embrace the power of ELK for centralized logging and data analysis. Next, we'll dive into the installation process itself.
Elasticsearch Installation and Configuration
Install Elasticsearch
- To get started with the ELK stack, we need to install Elasticsearch, the search engine that stores all collected logs. Here are the steps to install Elasticsearch on your Debian system:
$ sudo apt-get update - Install ElasticSearch:
$ sudo apt-get install elasticsearch
Configure Elasticsearch
Now that Elasticsearch is installed, we'll configure it to ensure it works seamlessly with our system. Open the Elasticsearch configuration file for editing:
$ sudo nano /etc/elasticsearch/elasticsearch.yml
In this configuration file:
- Uncomment the Port and specify the port number (e.g., 9200) for Elasticsearch.
- Uncomment and provide the correct network.host IP address.
- If needed, you can add cluster or node settings according to your requirements.
Once you've made these configurations, save the file and proceed to start the Elasticsearch service:
Reload systemd manager configuration
$ sudo systemctl daemon-reloadStart the Elasticsearch service
$ sudo systemctl start elasticsearch.serviceEnable the Elasticsearch service to start on boot
$ sudo systemctl enable elasticsearch.service
Kibana Installation and Configuration
Install Kibana
With Elasticsearch in place, it's time to set up Kibana, the web interface for visualizing and searching your logs within Elasticsearch. Here's how to install Kibana:
$ apt install kibana
Configure Kibana
Once Kibana is installed, we need to configure it to work seamlessly with our ELK stack. To configure Kibana, open the Kibana configuration file for editing:
$ sudo nano /etc/kibana/kibana.yml
In the kibana.yml configuration file:
- Uncomment the Port and specify the port number for Kibana (e.g., 5601).
- Uncomment and set the correct server.host for Kibana.
- Uncomment and specify the correct network.host for Elasticsearch.
Your kibana.yml should look something like this:
server.port: 5601
server.host: "yourserverip"
elasticsearch.hosts: ["http://localhost:9200"]
Save the configuration file and proceed to start the Kibana service:
Start the Kibana service
$ sudo systemctl start kibana.serviceEnable the Kibana service to start on boot
$ sudo systemctl enable kibana.service
Logstash Installation and Configuration
Install Logstash
Logstash plays a crucial role in the ELK stack as a data processing component. To install Logstash, use the following commands:
$ apt install logstash
Configure Logstash
Now that Logstash is installed, we need to configure it to communicate with our other ELK components and receive data from Filebeat. Here's how:
Create a configuration file to allow Filebeat to communicate with Logstash:
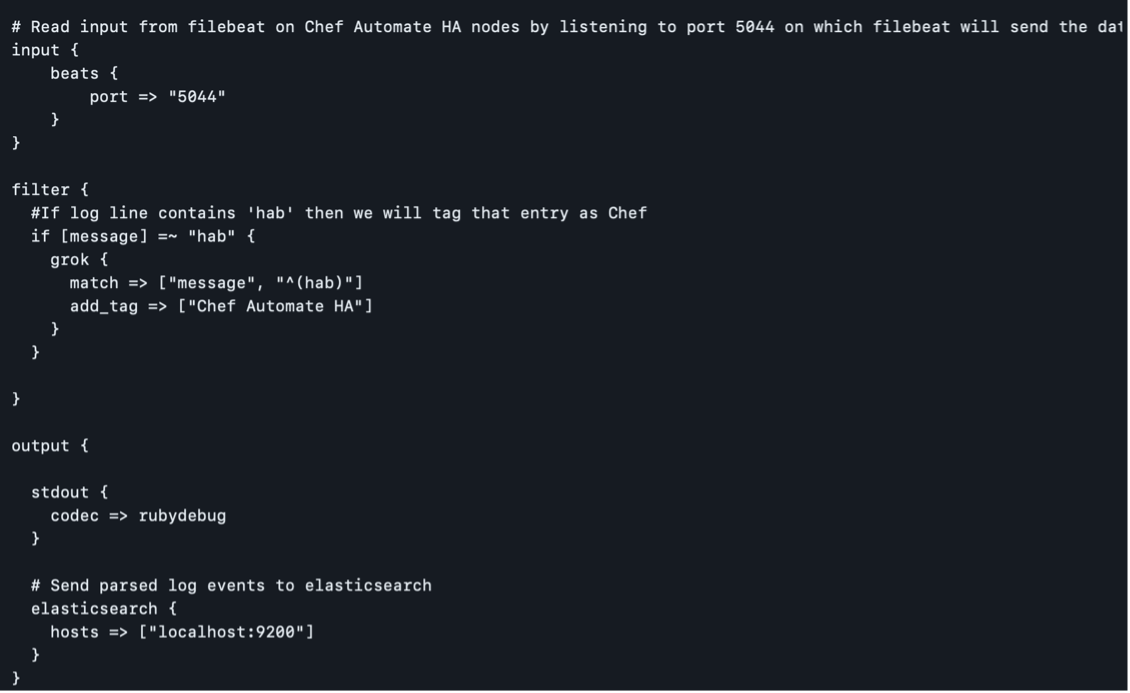
$ sudo nano /etc/logstash/conf.d/chef-beats-input.confIn the chef-beats-input.conf file, configure Logstash to listen to port 5044, where Filebeat will send the data:
Restart the Logstash service to apply the changes:
$ sudo systemctl restart logstash.service
Filebeat Installation and Configuration
Prerequisites
Before diving into Filebeat installation and configuration, make sure you've completed the following:
- Deployed and configured Logstash, Elasticsearch, and Kibana as part of your ELK stack.
- Set up Chef Automate HA with access to Logstash over the configured TCP Port (usually TCP 5044).
Installation Steps
To get started with Filebeat, follow these steps:
- Log into each of your Chef Automate HA nodes.
- Download and extract Filebeat using the following commands:
$ curl -L -O https://artifacts.elastic.co/downloads/beats/filebeat/filebeat-8.8.2-linux-x86_64.tar.gz
$ tar xzvf filebeat-8.8.2-linux-x86_64.tar.gz
More info on Configuration and Installation can be found here.
Filebeat Configuration
Once Filebeat is downloaded and extracted, it's time to configure it for your specific environment. Follow these steps:
- Modify the Filebeat configuration file, typically located at /etc/filebeat/filebeat.yml, using a text editor like nano:
$ sudo nano /etc/filebeat/filebeat.yml
the filebeat.yml file, ensure the following settings are configured under Filebeat Inputs: a. type is set to journald. b. id is set to everything. c. enable is set to true.
In the same configuration file, navigate to Logstash Outputs. Here, specify the Logstash host and port to which Filebeat should send the logs.
Save and close the filebeat.yml file.
More info on Filebear Configuration and Installation can be found here.
Enable Filebeat System Module
To enhance Filebeat's capabilities, enable the System module by running the following command:
sudo filebeat modules enable system
Modify the Filebeat System Module Configuration
Next, modify the Filebeat module configuration file for System. This file is typically located at /etc/filebeat/modules.d/system.yml. Double-check to see if it’s correctly configured, including the paths to your log files.
Set Up Filebeat Ingest Pipelines
To further optimize Filebeat, set up Filebeat ingest pipelines with this command:
$ sudo filebeat setup --pipelines --modules system
Start and Enable Filebeat
Finally, start and enable the Filebeat service:
$ sudo systemctl start filebeat $ sudo systemctl enable filebeat
With Filebeat now installed and configured, it will efficiently collect and forward your logs to the ELK stack for analysis and visualization.
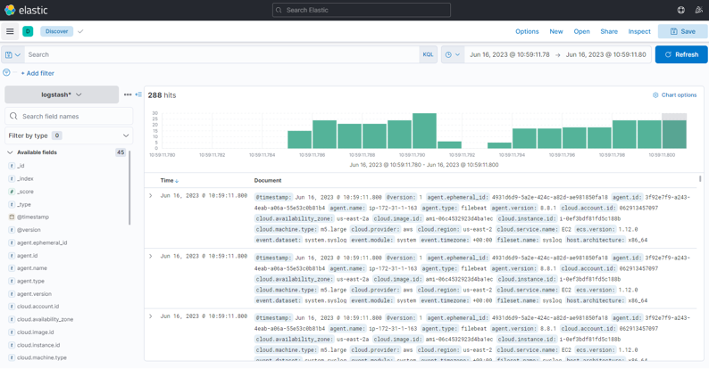
Visualizing Logs in Kibana
Once your ELK stack is set up and logs flow in, it's time to make sense of your data. Kibana, with its powerful visualization and querying capabilities, is your go-to tool for this task. Here's how to get started:
Access Kibana
Open your web browser and navigate to Kibana.
Select the "Explore on my own" option to have full control over your Kibana experience.
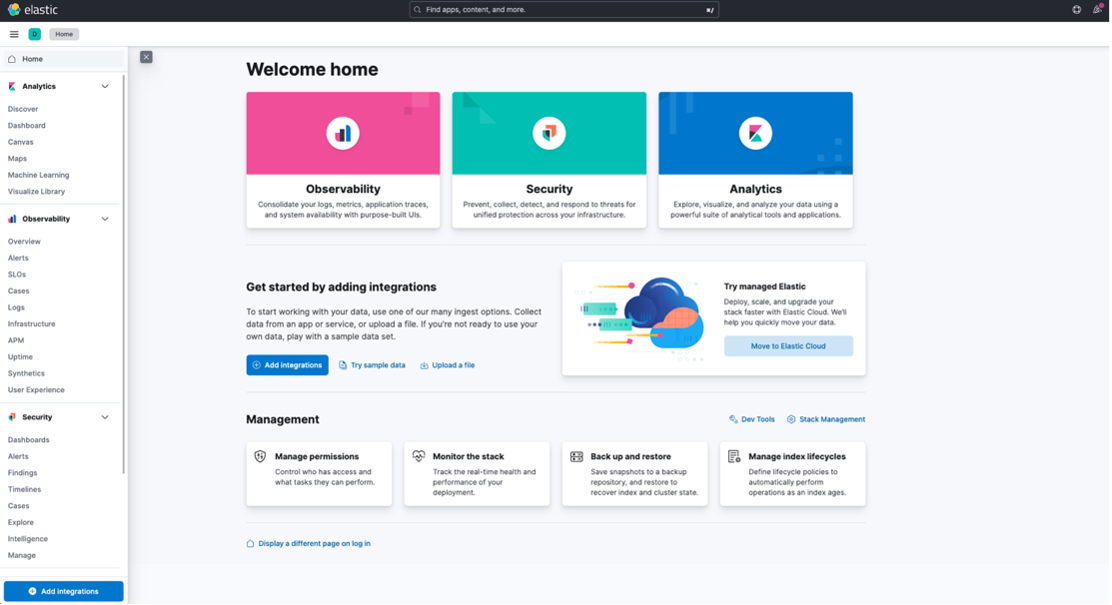
You'll land on the Kibana Home page, your central hub for log analysis and visualization.
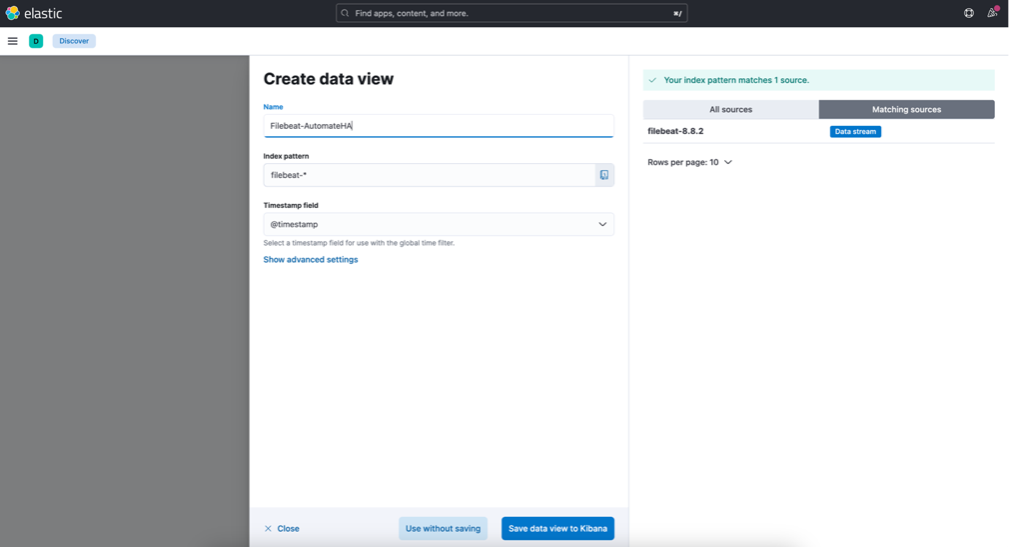
Creating an Index Pattern
In the left-hand sidebar, click on the "Discover" tab. This is where you can explore your log data.
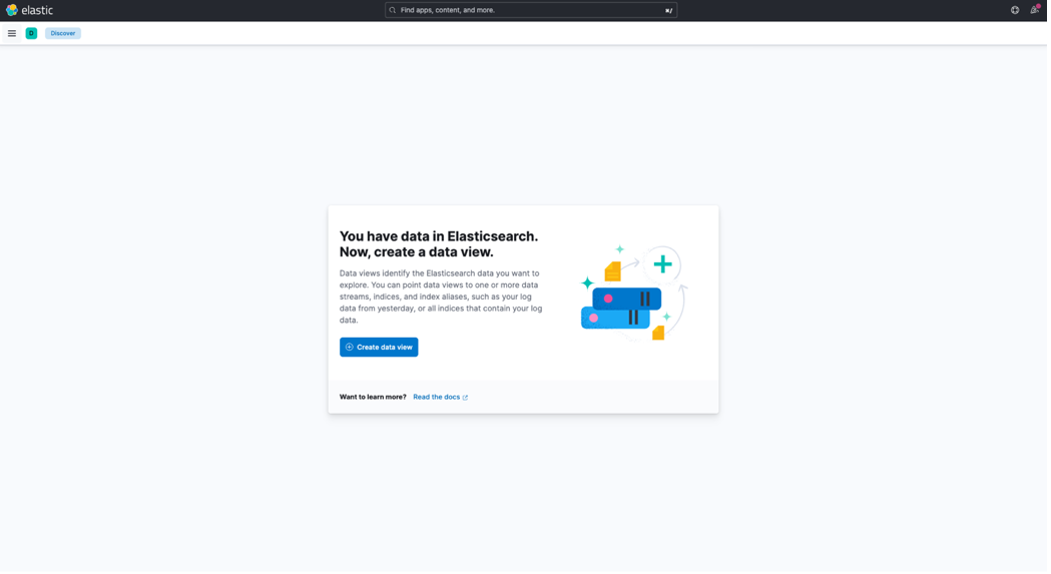
To create an Index Pattern, click on "Create DataView."
This Index Pattern will allow you to view the logs sent to Logstash. Follow the prompts to create it.
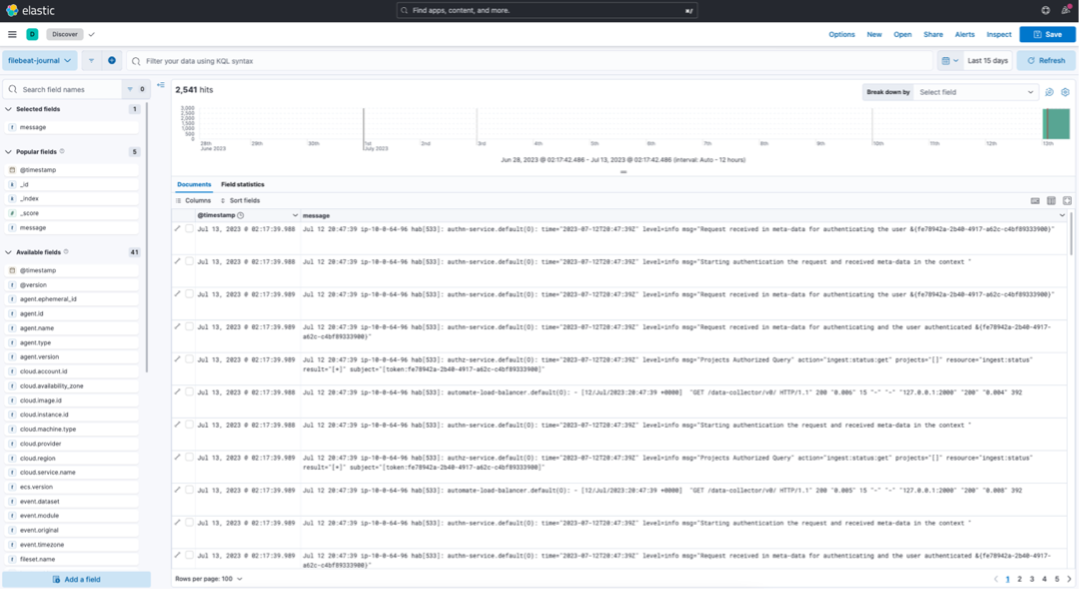
Now, in Kibana, navigate to "Analytics/Discovery" and select the Index Pattern you just created. This is where the logs from your Chef Automate Servers will be displayed.
Custom Filtering with Filebeat
Sometimes, you might want to send only specific service-level logs to your centralized logging server. Here's how you can achieve that:
- Modify the Filebeat configuration file, typically located at
/etc/filebeat/filebeat.yml:
$ sudo nano /etc/filebeat/filebeat.yml - Under the "Filebeat Inputs" section, add the following processor configuration:
This configuration tells Filebeat to drop events that do not match the specified regular expression for "filtered service."
processors:
- drop_event:
when.not.regexp.message: ''<filtered service>'
As an example, if you want to send only "authn-service" logs to Logstash, your configuration might look like this:
processors:
- drop_event:
when.not.regexp.message: 'authn-service' - Save and close the filebeat.yml file.
- In Kibana, navigate to "Discover," and you will see the filtered results based on your configuration.
5. Click into the logs to confirm that the filter is working as expected.
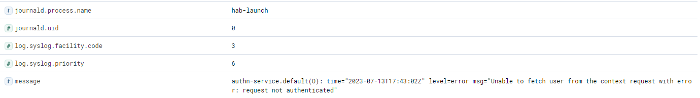
Authn-service
By exploring the core elements of the ELK stack and providing insights into its integration with Chef Automate HA, you can efficiently manage and analyze your logs, focusing on the specific data that matters most to your organization.
With HA and the ELK stack in your arsenal, your organization is better equipped to navigate the evolving landscape of DevOps and automation while maintaining the utmost reliability and performance.
Further learn about Chef Automate HA to ensure your infrastructure remains resilient and operational, even in the face of unexpected challenges: Chef Automate HA